
Who Owns the Map?
Part III: Gerrymandering and the New Geography of Power

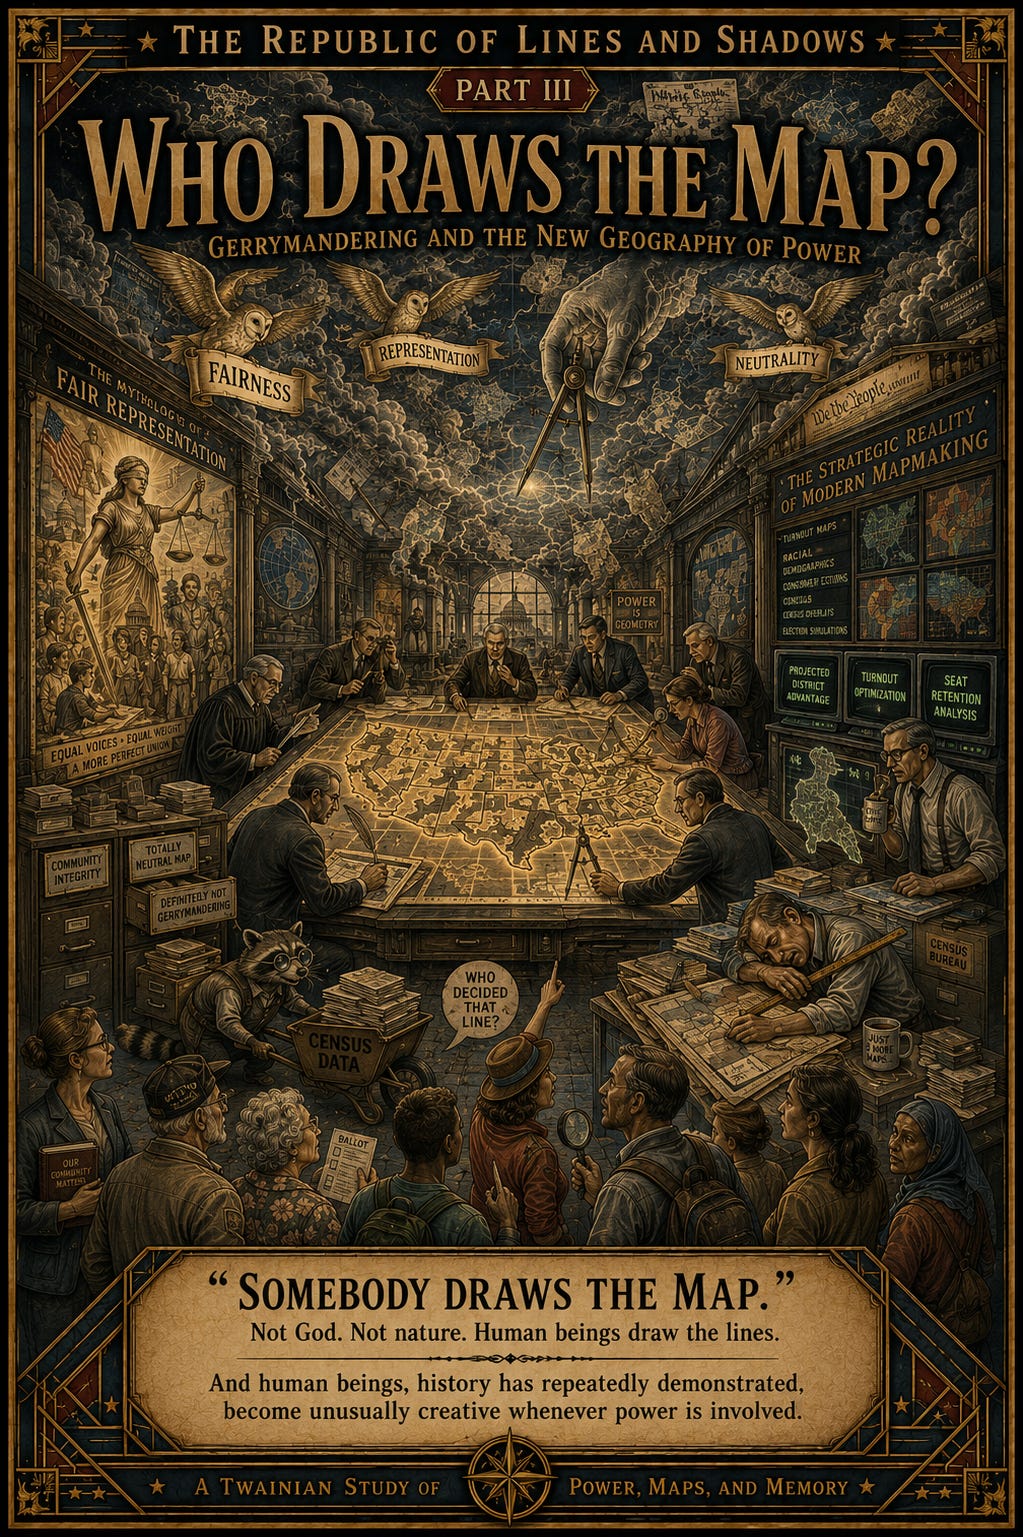
Now that we understand districts, we can finally arrive at the truly unsettling part:
Somebody draws the map.
Not God.
Not nature.
Not a flock of impartial civic owls descending from the heavens carrying sacred geometry in their talons.
Human beings draw the lines.
And human beings, history has repeatedly demonstrated, become unusually creative whenever power is involved.
🗺️
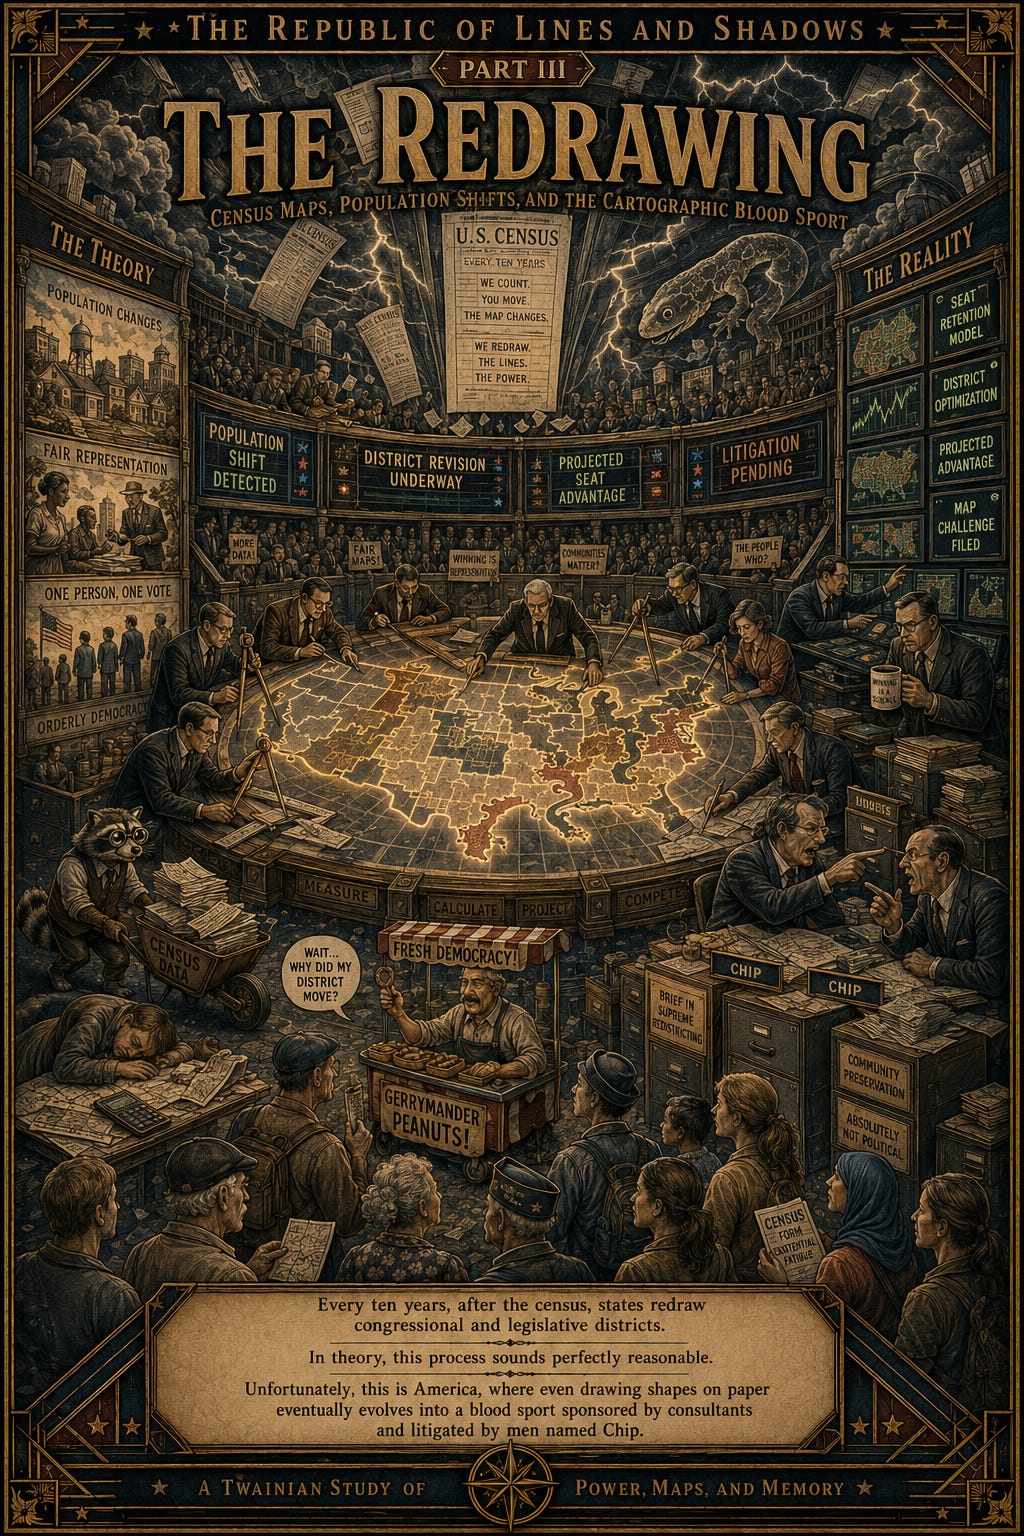
Every ten years, after the census, states redraw congressional and legislative districts to reflect population changes.
In theory, this process sounds perfectly reasonable.
People move.
Cities grow.
Populations shift.
Representation adjusts accordingly.
Simple.
Unfortunately, this is America, where even the process of drawing shapes on paper eventually evolves into a blood sport sponsored by consultants and litigated by men named Chip.
⚖️
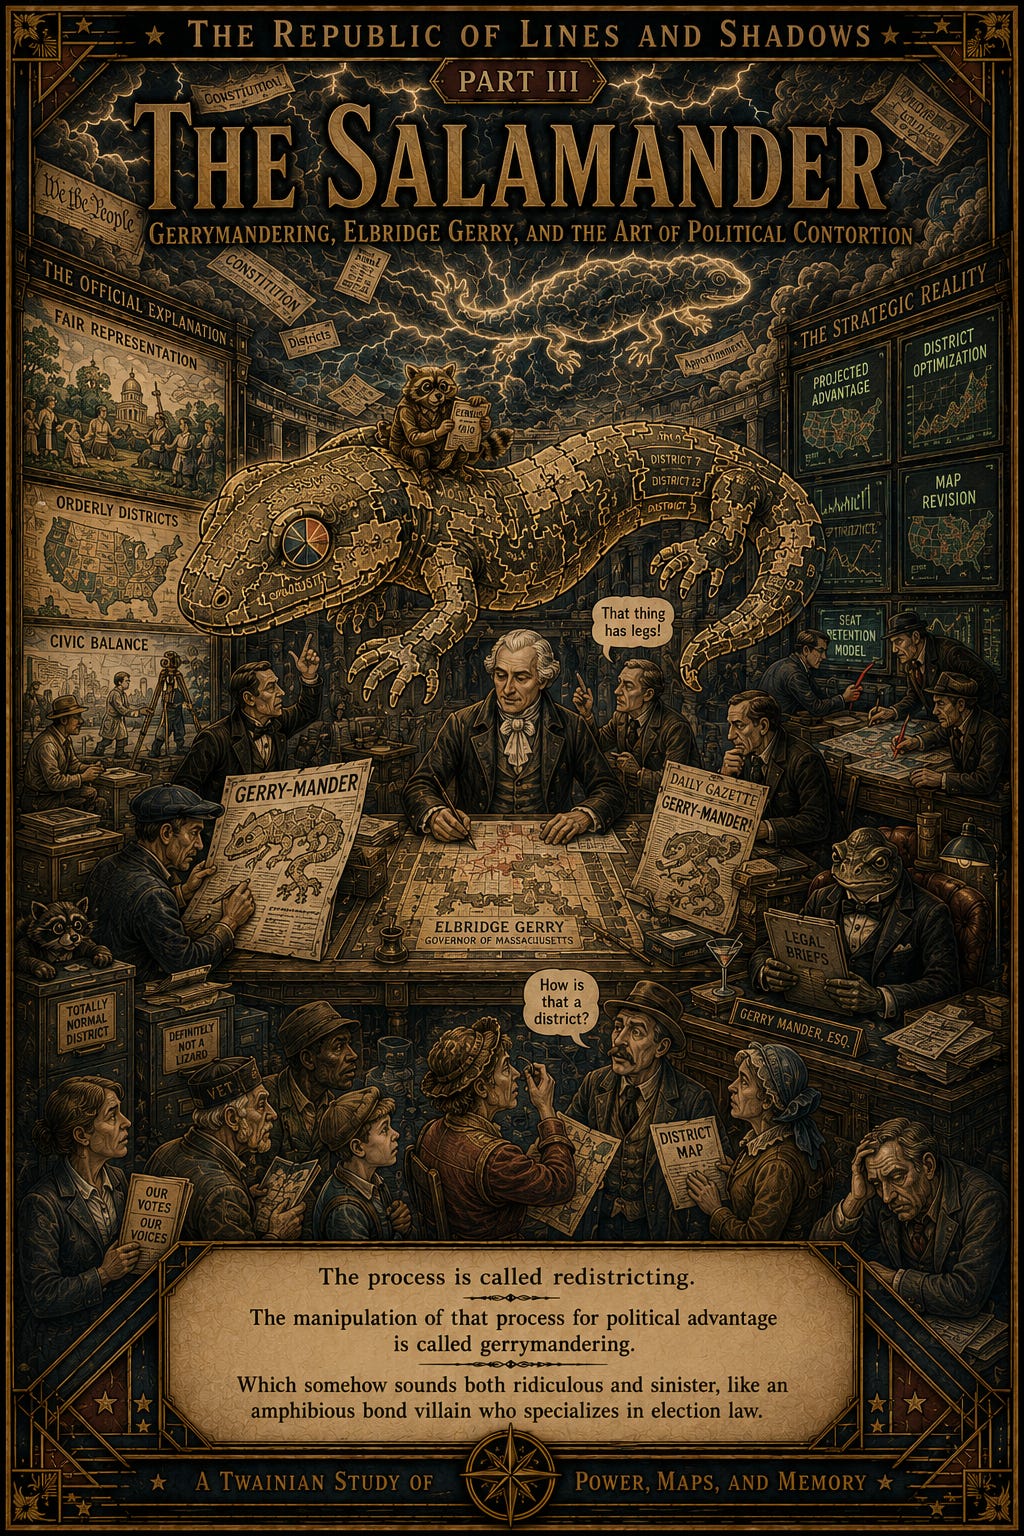
The process is called redistricting.
The manipulation of that process for political advantage is called gerrymandering.
The term dates back to 1812, when Massachusetts Governor Elbridge Gerry approved a district map so grotesquely contorted that critics claimed it resembled a salamander.
Thus:
Gerry-mander.
Which somehow sounds both ridiculous and sinister, like an amphibious bond villain who specializes in election law.
🦎
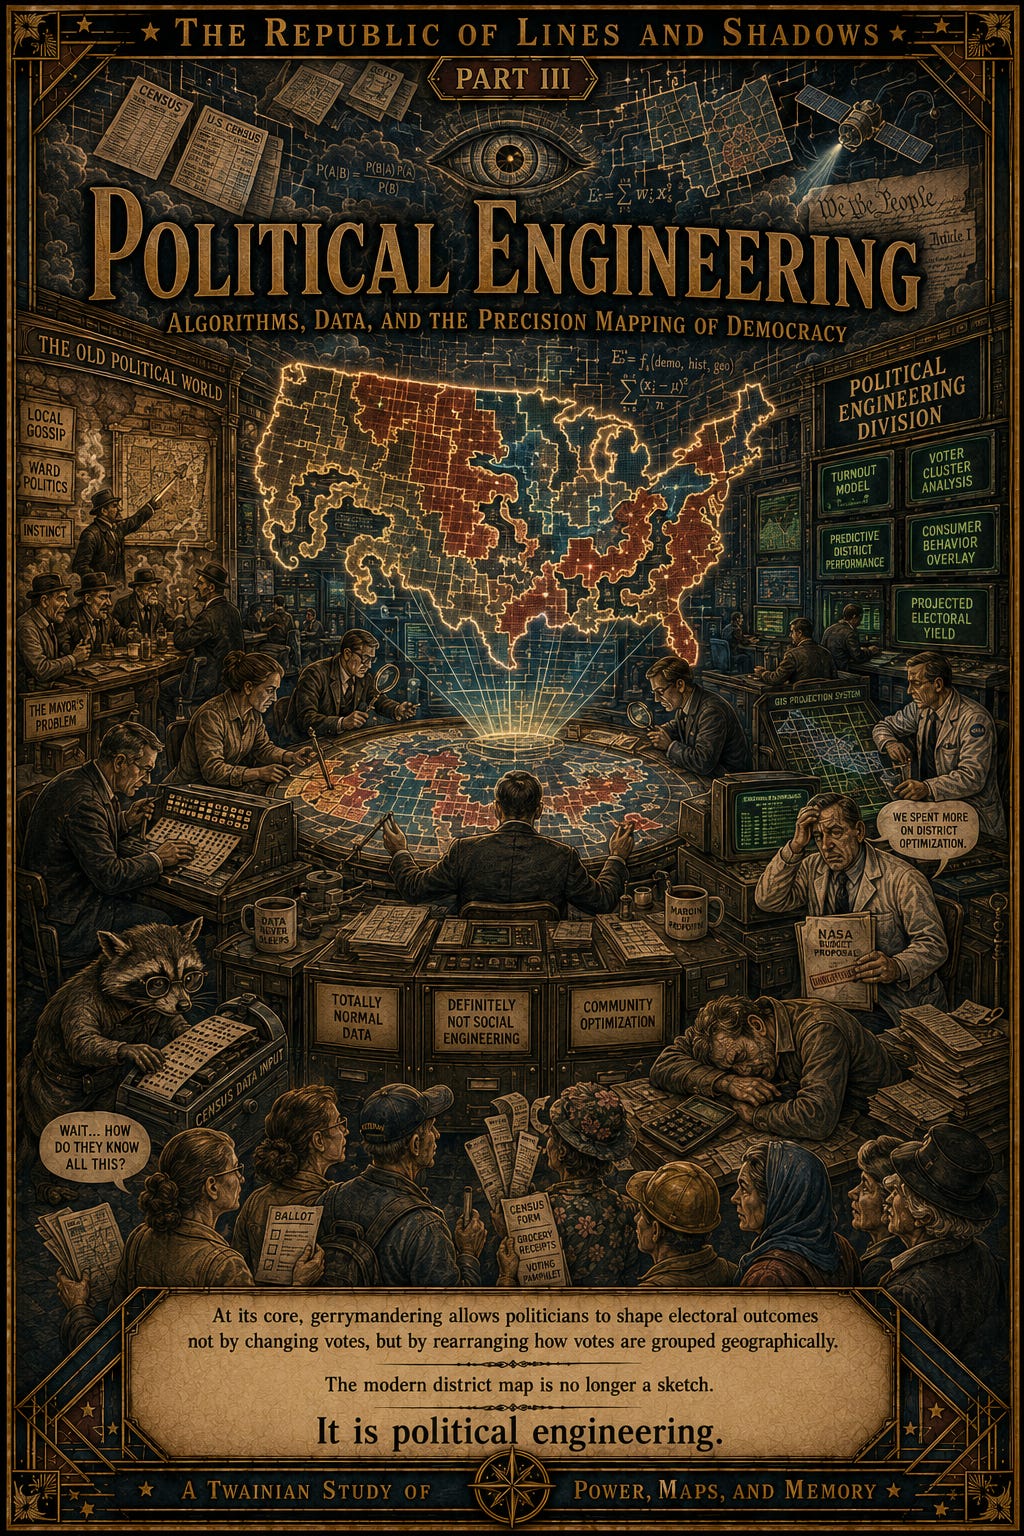
At its core, gerrymandering allows politicians to shape electoral outcomes not by changing votes, but by rearranging how votes are grouped geographically.
And once modern technology enters the picture, the process becomes astonishingly precise.
The old political bosses once relied on instinct, local gossip, and whatever bartender happened to know which neighborhoods hated the mayor.
Modern mapmakers use:
demographic databases,
voting histories,
census data,
consumer behavior,
geographic information systems,
predictive modeling,
and algorithms sophisticated enough to make NASA look underfunded.
The modern district map is no longer a sketch.
It is political engineering.
📊
Two primary techniques dominate gerrymandering.
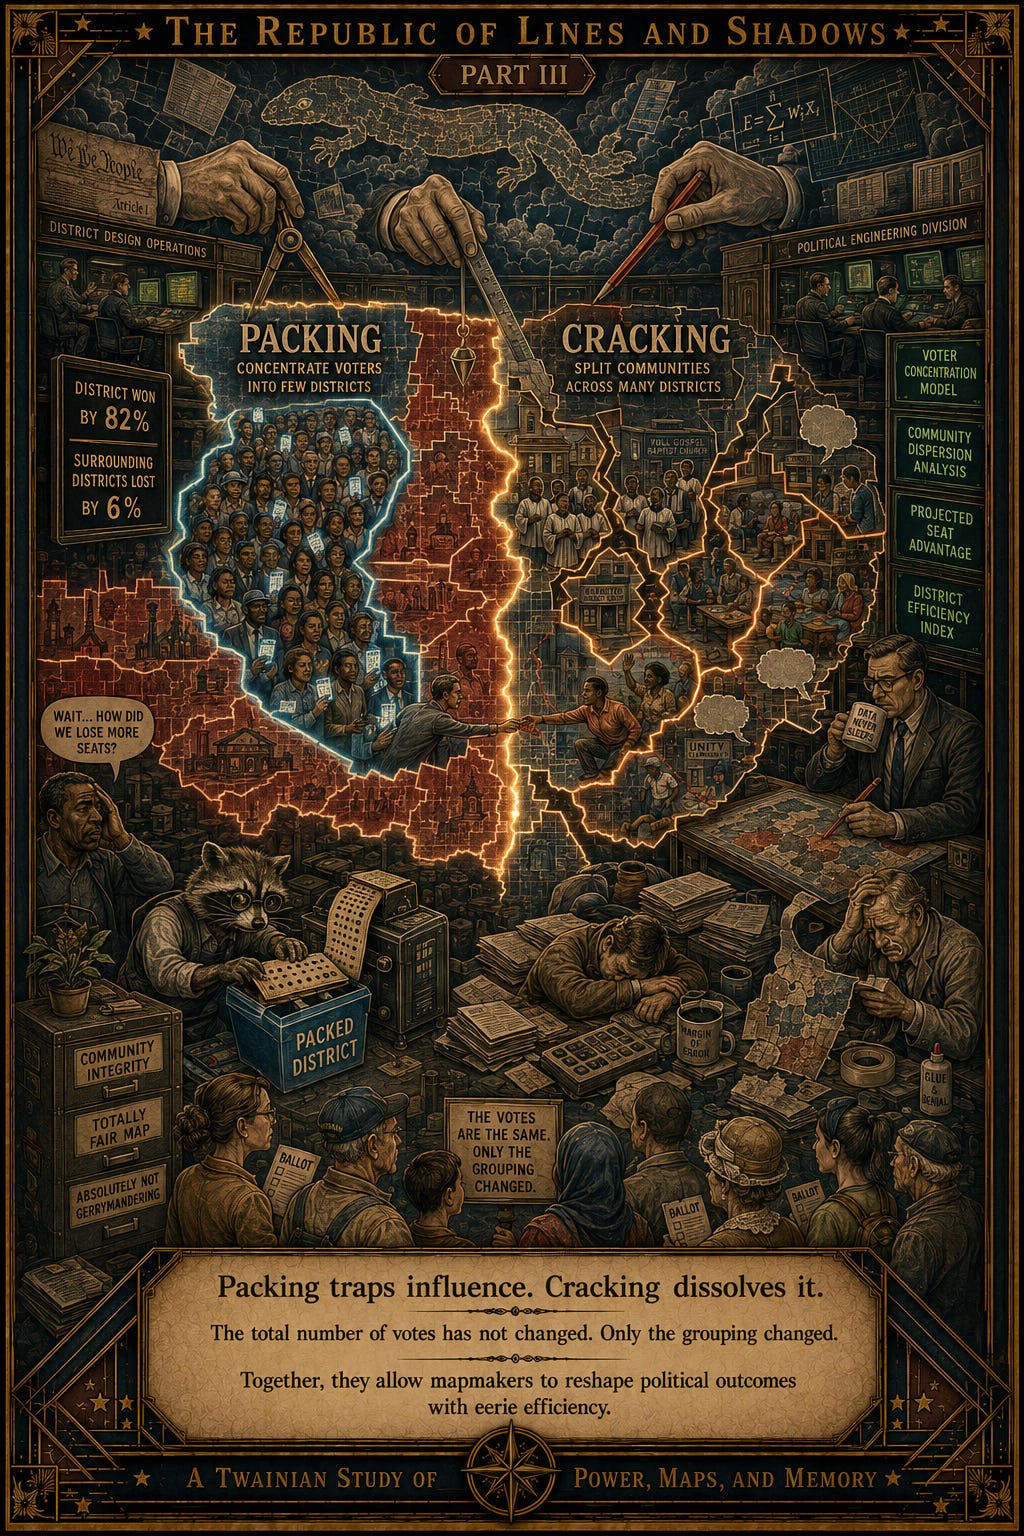
The first strategy is called packing.
Packing means concentrating large numbers of similar voters into a small number of districts.
For example, mapmakers might pack large numbers of Black voters or Democratic voters into one district where they win overwhelmingly.
That district becomes extremely safe for that group.
But because each district elects its own representative, concentrating too many voters into one district can reduce their influence in surrounding districts.
The opposing party can then win those surrounding districts by smaller margins and gain more seats overall.
The total number of votes has not changed.
Only the grouping changed.
The second technique is called cracking.
Cracking splits communities apart across several districts so their collective voting power weakens.
A neighborhood that might have formed a strong voting bloc suddenly gets divided into fragments scattered across multiple districts.
Instead of one loud voice, you get several smaller whispers drifting helplessly through committee hearings.
Packing traps influence.
Cracking dissolves it.
Together, they allow mapmakers to reshape political outcomes with eerie efficiency.
🧩
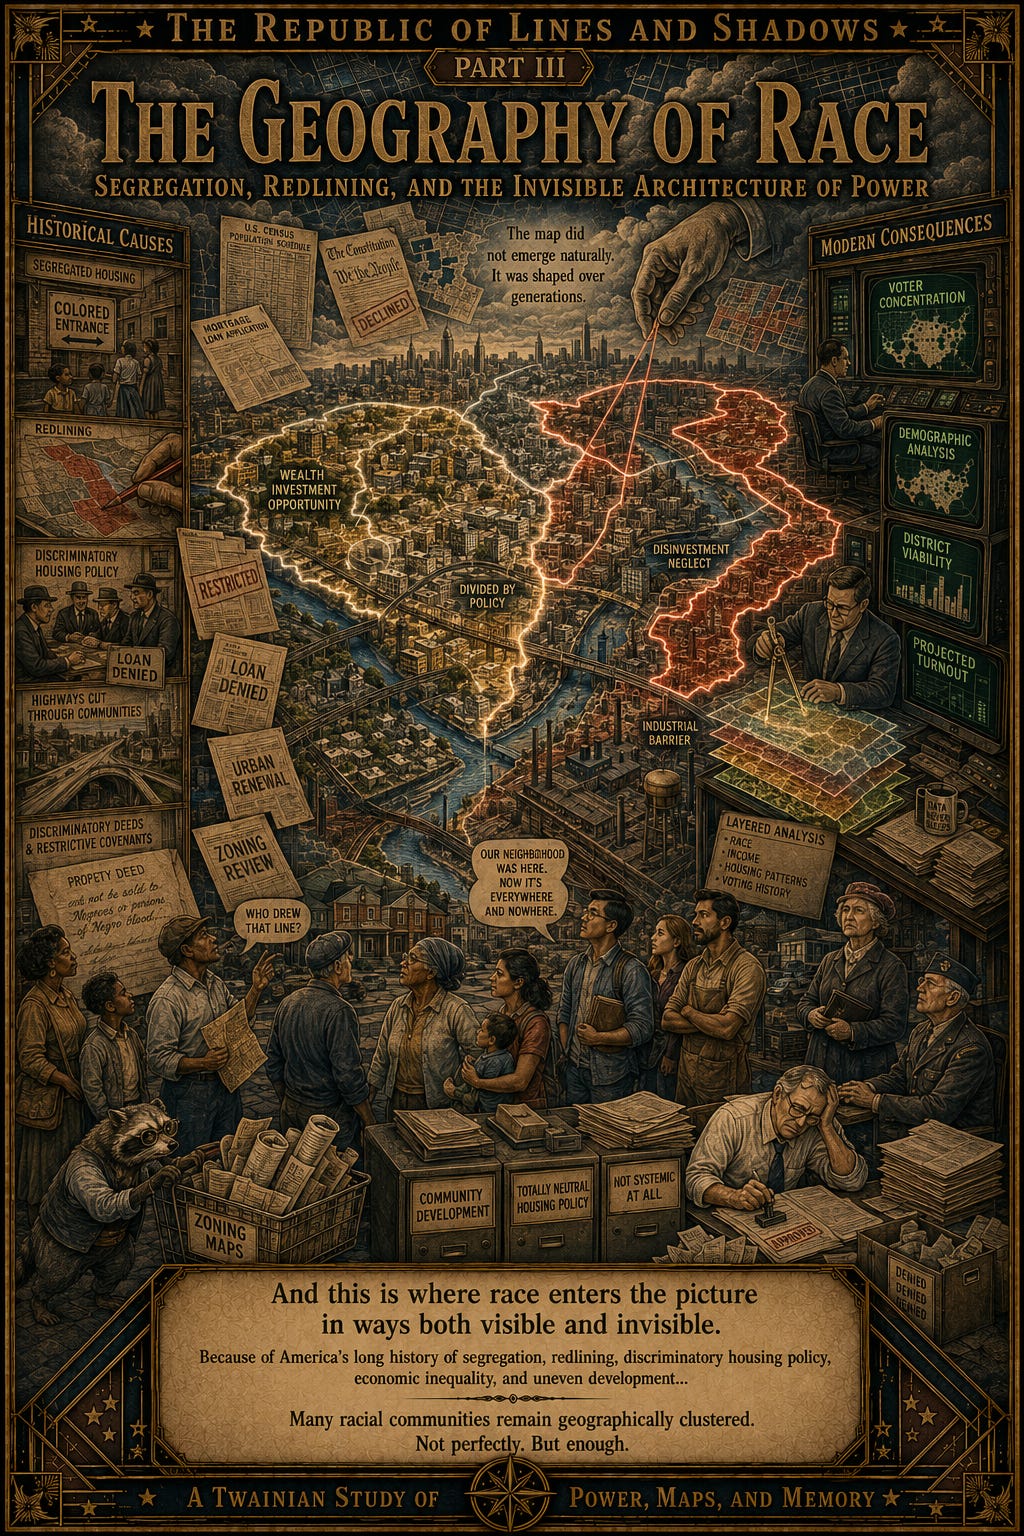
And this is where race enters the picture in ways both visible and invisible.
Because of America’s long history of:
segregation,
discriminatory housing policy,
redlining,
economic inequality,
and uneven development,
many racial communities remain geographically clustered.
Not perfectly.
But enough.
A district map, therefore, can influence racial political power without ever explicitly mentioning race at all.
And this creates one of the great legal gray zones of modern American politics.
States accused of racial gerrymandering often respond:
“These maps were drawn for partisan reasons, not racial ones.”
Critics respond:
“In many places, race and party overlap so heavily that pretending they are unrelated is like insisting smoke and fire are merely close acquaintances.”
🔥
Many of the fiercest modern redistricting battles emerged in:
Texas,
Georgia,
Alabama,
Louisiana,
and North Carolina.
The pattern is difficult to ignore.
These district maps did not emerge naturally from the forest like mushrooms after rain.
Many overlap directly with the historical geography of slavery, segregation, and the long struggle over Black political participation in the South.
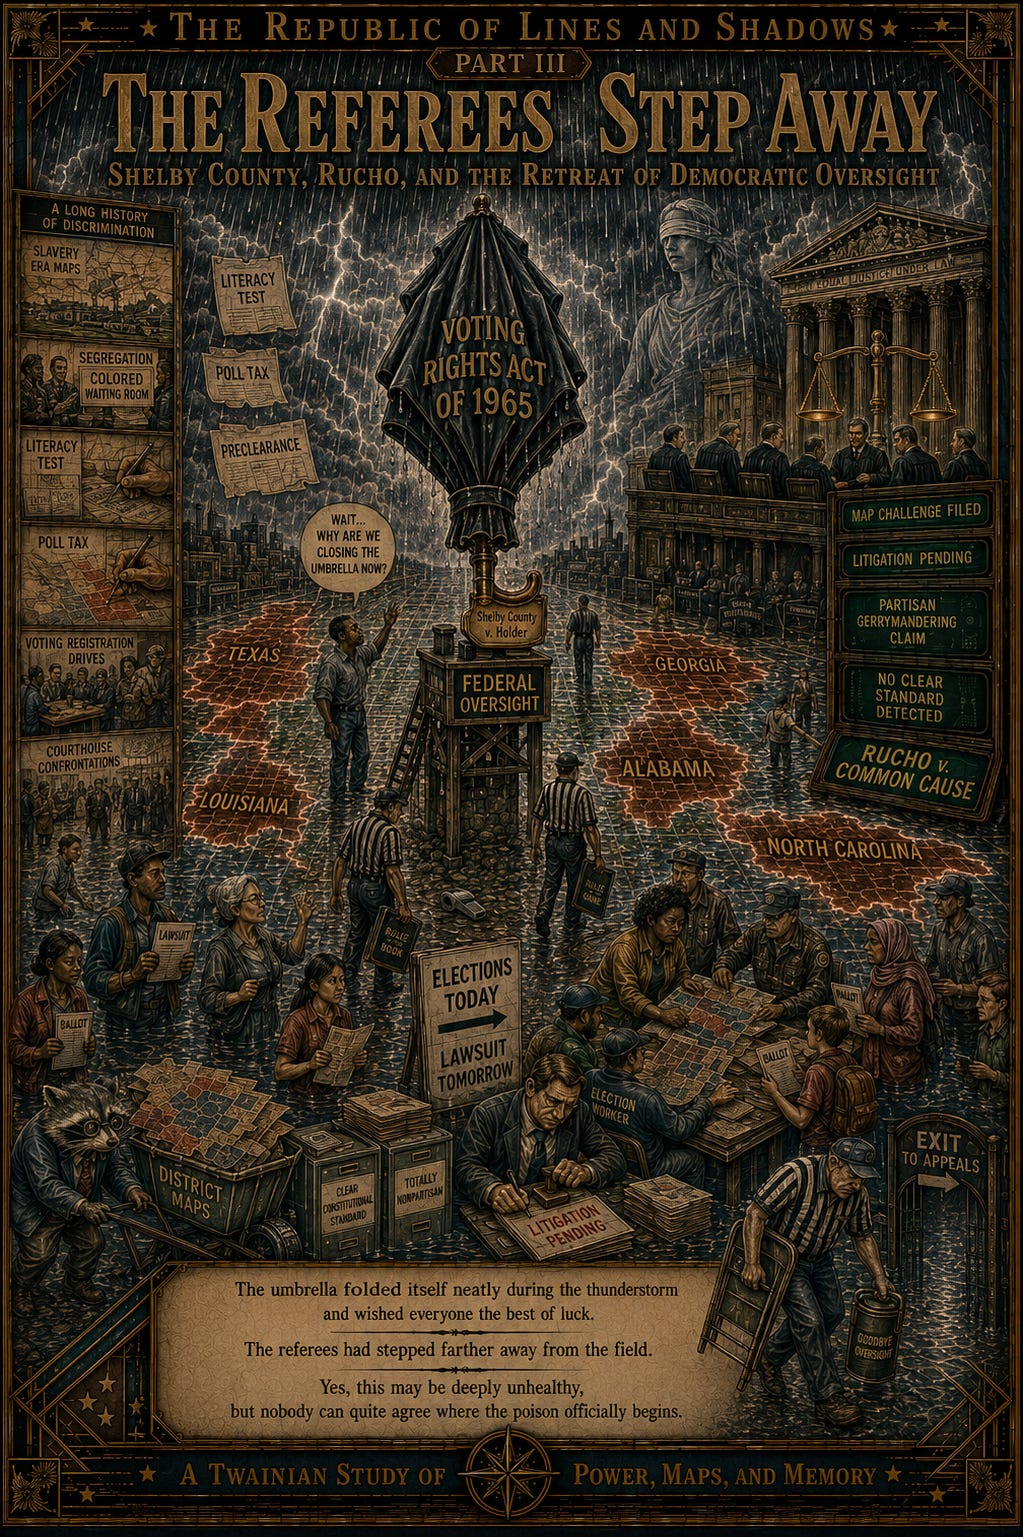
Which is precisely why the weakening of the Voting Rights Act of 1965 mattered so much.
Before Shelby County v. Holder, many states with histories of racial discrimination had to submit proposed district maps for federal approval before those maps could take effect.
The government could stop potentially discriminatory maps before elections occurred.
After Shelby County, that system largely disappeared.
Now maps are often implemented first and challenged later through lawsuits that can drag on for years while elections proceed under contested boundaries.
The burden shifted again.
The umbrella folded itself neatly during the thunderstorm and wished everyone the best of luck.
🌧️
Then came another major Supreme Court case:
Rucho v. Common Cause.
The Court ruled that federal courts generally could not resolve disputes over partisan gerrymandering.
The majority acknowledged that extreme partisan gerrymandering may conflict with democratic ideals.
But the Court concluded there was no clear constitutional standard for determining when partisan mapmaking had gone too far.
Which, translated loosely into ordinary English, sounded somewhat like:
“Yes, this may be deeply unhealthy, but nobody can quite agree where the poison officially begins.”
Critics were horrified.
Supporters argued the Constitution leaves such disputes to the political process itself.
Either way, one thing became unmistakably clear:
The referees had stepped farther away from the field.
🏛️
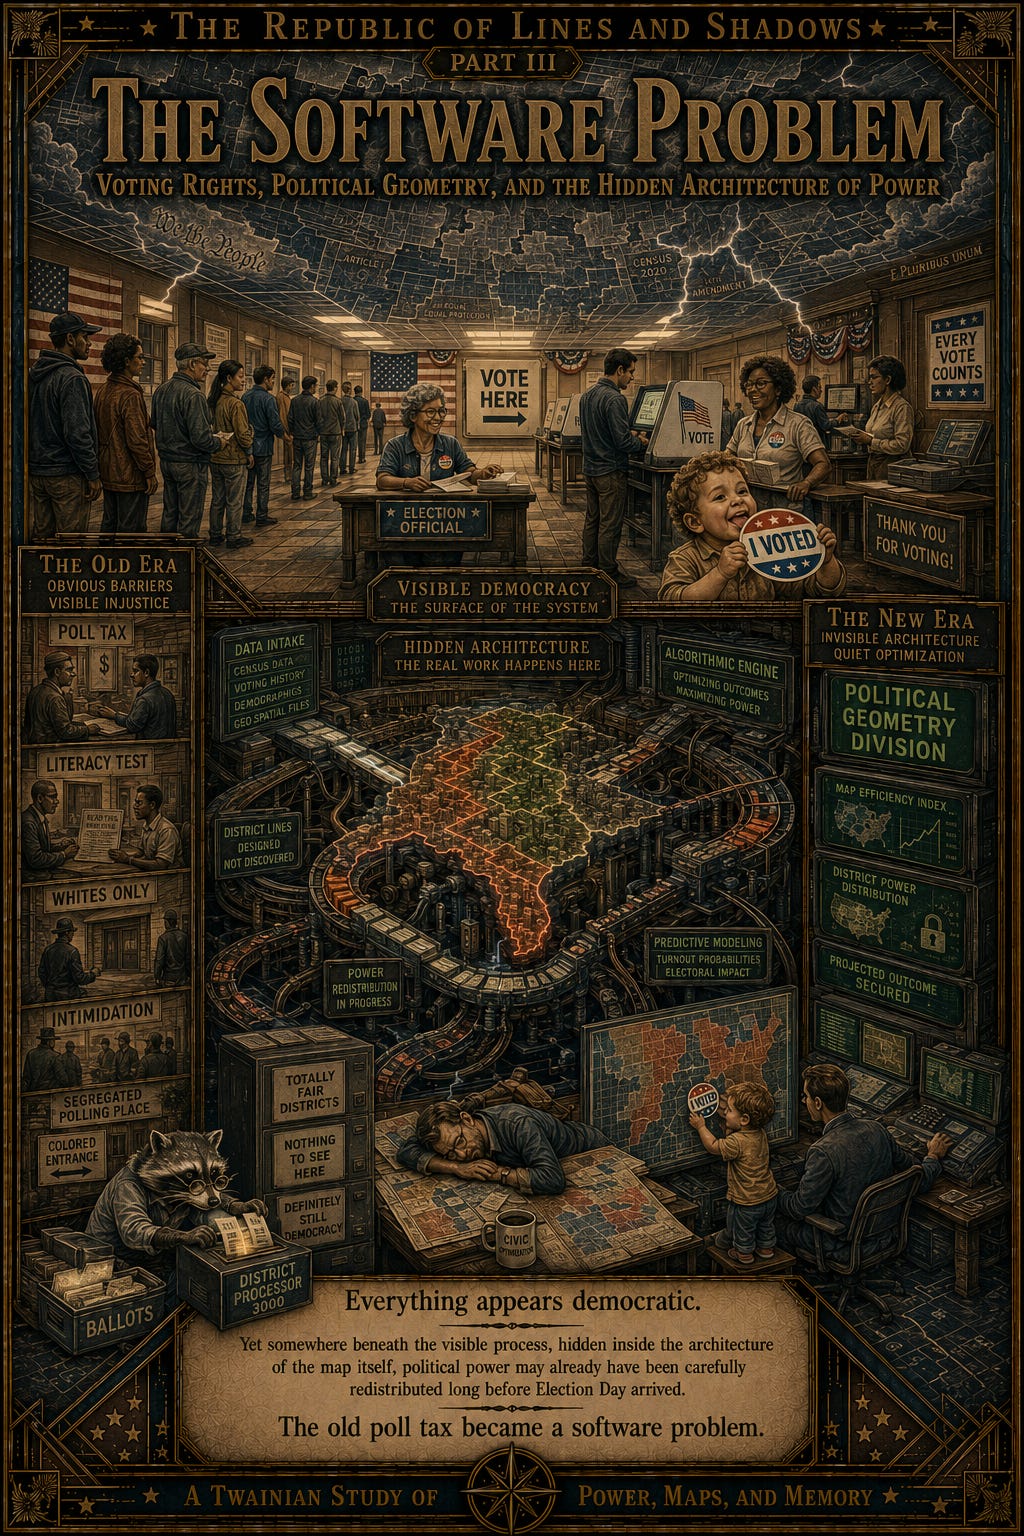
And so American democracy entered a strange new era.
The fight over voting rights no longer revolves solely around whether citizens can vote.
It now includes whether the surrounding political geometry allows those votes to carry meaningful force once cast.
The polling place may appear orderly.
The ballot may slide smoothly into the machine.
The election workers may smile politely beneath fluorescent lights while somebody’s toddler licks an “I Voted” sticker in the corner.
Everything appears democratic.
Yet somewhere beneath the visible process, hidden inside the architecture of the map itself, political power may already have been carefully redistributed long before Election Day arrived.
The old poll tax became a software problem.